Steve Spencer's Blog

Blogging on Azure Stuff

Migrating Azure Scheduled Web Jobs to Logic Apps

If you have scheduler jobs running in Azure you may have received an email recently stating that the scheduler is being retired and that you need to move your schedules off by 31st December 2019 at the latest and you also will not be able to view your schedules via the portal after 31st October.

This is all documented in the following post:  https://azure.microsoft.com/en-us/updates/extending-retirement-date-of-scheduler/

There is an alternative to the Scheduler and that is Logic Apps and there is a link on the page to show you how to migrate.

I’m currently using the scheduler to run my webjobs on various schedules from daily and weekly to monthly. Webjobs are triggered by using an HTTP Post request and I showed how to set this up using the scheduler in a previous post :

Creating a Scheduled Web Job in Azure

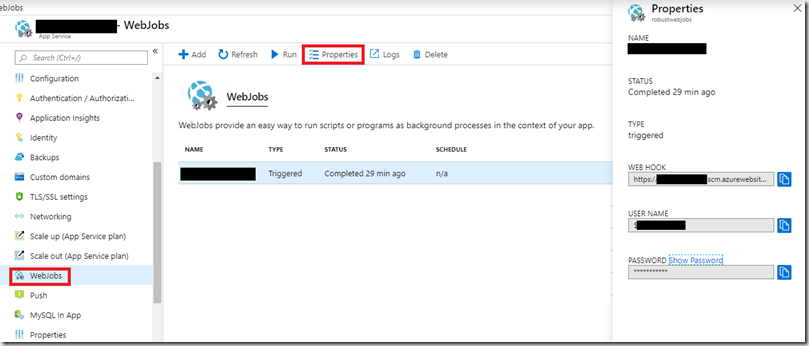
I will build on that post and show how you can achieve the same thing using Logic Apps. You will need the following information in order to configure the Logic App: Webhook URL, Username, Password

You can find these in the app service that is running your webjob.  Click “Webjobs”, select the job you are interested in the click “Properties”. This will display the properties panel where you can retrieve all these values.
image

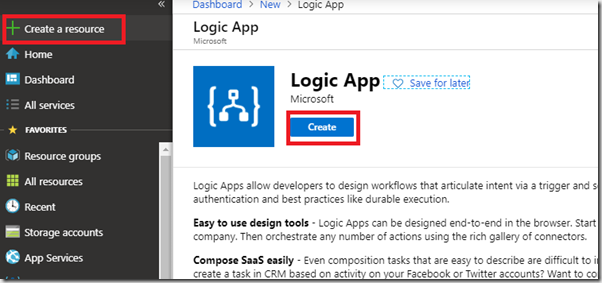
Now you need to create a Logic App. In the Azure Portal dashboard screen click “Create a Resource” and enter Logic App in the search box, then click “Create”
image

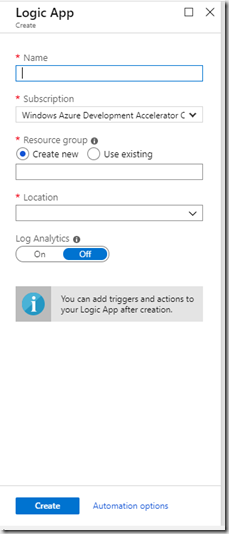
Complete the form and hit Create

image

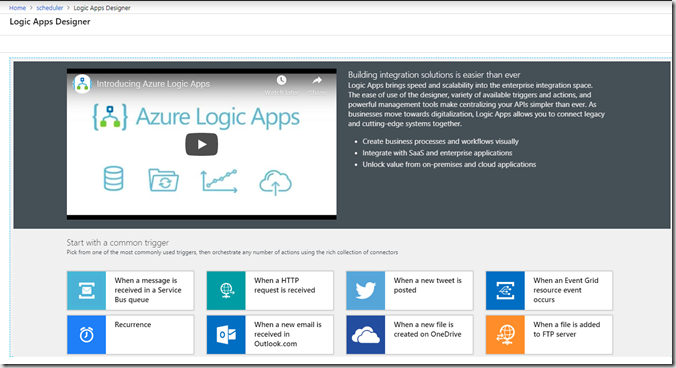
Once the resource has created you can then start to build your schedule. Opening the Logic App for the first time should take you to the Logic App Designer. Logic Apps require a trigger to start them running and there are lots of different triggers but the one we are interesting in, is the Recurrence trigger
image

Click “Recurrence” and this will be added to the Logic App designer surface for you to configure

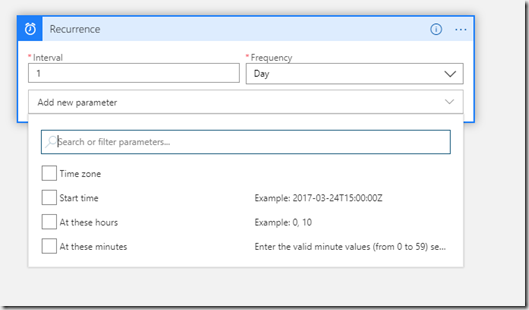
I want to set my schedule to run at 3am every day so I select frequency to be Day and interval to be 1, then click “Add New Parameter”
image

Select “At these hours” & “At these minutes”. Two edit boxes appear and you can add 3 in the hours box and 0 in the minutes box. You have now set up the schedule. We now need to configure the Logic App to trigger the web service. As as discussed above we can use a web hook.

All we have in the Logic App is a trigger that starts the Logic App at 3am UTC, we now need to add an Action step that starts the web job running.

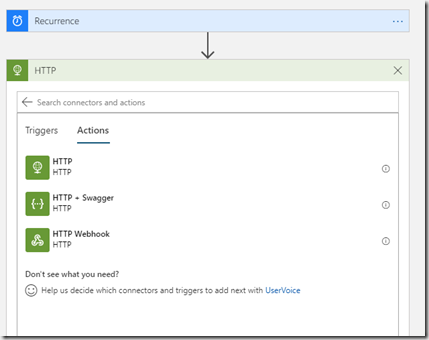
Below the Recurrence box there is a box called “+ New Step”, click this and then search for “HTTP”
image

Select the top HTTP option

image

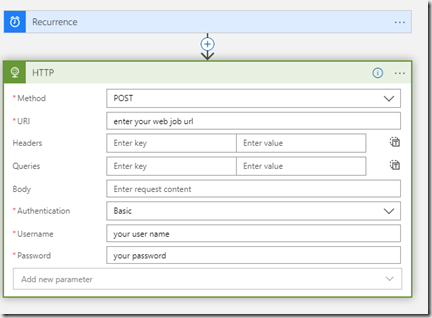
Select POST as the method and Basic as Authentication, then enter your url, username and password

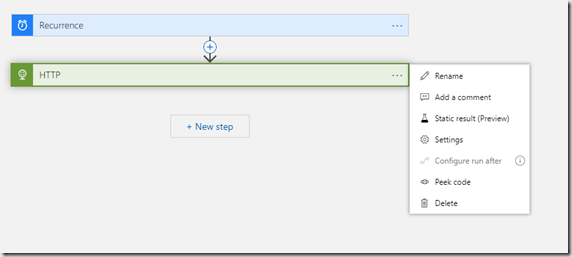
The web job is now configured and the Logic App can be saved by clicking the Save button. If you want to rename each of the steps so you can easily see what you have configured then click “…” and select “Rename”
image

You can test the Logic App is configured correctly by triggering it to run. This will ignore the schedule and run the HTTP action immediately
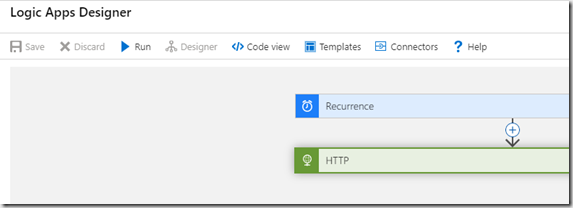
image

If the request was successful then you should see ticks appear on the two actions or if there are errors you will see a red cross and be able to see the error message
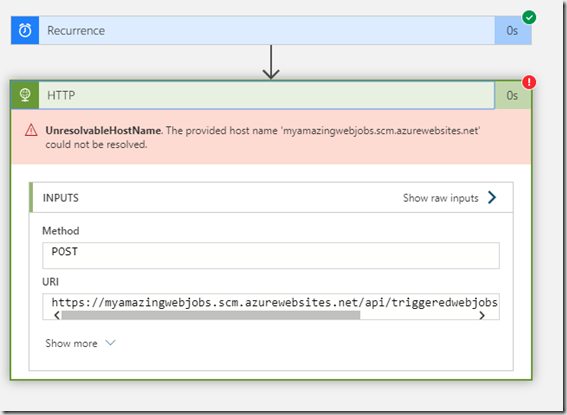
image

If the web job successfully ran then open the web job portal via the app services section to see if your web job has started.

If you want to trigger a number of different web jobs on the same schedule then you can add more HTTP actions below the one you have just set up. If you want to delay running a job for a short while you can add a Delay task.

If you want to run on a weekly or monthly schedule then you will need to create a new Logic App with a Recurrence configured to the schedule you want and then add the HTTP actions as required.

The scheduler trigger on the Logic App will be enabled as soon as you click Save. To stop it triggering you can Disable the Logic App on the Overview screen once you exit the Designer

image

Hopefully this has given you an insight in to how to get started with Logic Apps. Take a look at the different triggers and actions as see that you can do a lot more than just scheduling web jobs

Adding Application Insights Logging to your code

This is the fourth of a series about Application Insights and Log analytics. I’ve shown you how to add existing logs, using the log analytics query language to view you logs and how to enhance your query to drill down and get to the logs you are interested in. This post is about how you can add logs from your code and provide the information to allow you refine your queries and help you to diagnose your faults more easily

If you don’t already have application insights then you can create a new instance in the Azure portal (https://portal.azure.com/)

Get your application insights key from the azure portal. Click on your application insights instance and navigate to the Overview section then copy your instrumentation key. You will need this in your code.

image

In your project, add application insights via nuget :

Install-Package Microsoft.ApplicationInsights -Version 2.10.0

In you code you need to assign the key to Application Insights as follows:

TelemetryConfiguration configuration = TelemetryConfiguration.CreateDefault();
configuration.InstrumentationKey = “put your key here”;

To log details using application insights then you need a telemetry client.

TelemetryClient telemetry = new TelemetryClient(configuration);

The telemetry client has a larger number of features than I am not going to talk about here as I am just interested in logging today. There are three methods of interest: TrackEvent, TrackException and TrackTrace.

I use TrackEvent to log out things like start and end of methods of if something specific occurs that I want to log; TrackException is for logging Exception details and TrackTrace is for everything else.

telemetry.TrackEvent("Some Important Work Started");
try {
     telemetry.TrackTrace("I'm logging out the details of the work that is being done", SeverityLevel.Information); } catch(Exception ex) {
     telemetry.TrackException(ex); } telemetry.TrackEvent("Some Important Work Completed");

You now have the basics for logging. This will be useful to some extent, but it will be difficult to follow the traces when you have a busy system with logs of concurrent calls to the same methods. To assist you to filter your logs it would be useful to provide some identifying information that you can add to your logs to allow you to track and trace calls through your system. You could add these directly to your logs but this then makes your logs bloated and difficult to read. Application Insights provides a mechanism to pass properties along with the logs which will appear in the  Log Analytics data that is returned from your query. Along with each log you can pass a dictionary of properties. I add to the set of properties as the code progresses to provide identifying information to assist with filtering the logs.I generally add in each new identifier as they are created. I can then use these in my queries to track the calls through my system and remove the ones I am not interested in. Diagnosing faults then becomes a lot easier. To make this work then you need to be consistent with the naming of the properties so that you always use the same name for the same property in different parts of the system. Also try and be consistent about when you use TrackEvent and TrackTrace. You can set levels for your traces based upon the severity level (Verbose, Information, Warning, Error, Critical)

TelemetryConfiguration.Active.InstrumentationKey = Key;
TelemetryClient telemetry = new TelemetryClient(); 
var logProperties = new Dictionary();

logProperties.Add("CustomerID", "the customer id pass through from elsewhere");

telemetry.TrackEvent("Some Important Work Started", logProperties);
try
{
      var orderId = GenerateOrder();
      logProperties.Add("OrderID", orderId.ToString());
      telemetry.TrackTrace("I just created an order", logProperties);

      var invoiceId = GenerateInvoice();
      logProperties.Add("InvoiceID", invoiceId.ToString());
      telemetry.TrackTrace("I've just created an invoice", logProperties);

      SendInvoice(invoiceId);
}
catch (Exception ex)
{
      telemetry.TrackException(ex, logProperties);
}
telemetry.TrackEvent("Some Important Work Completed", logProperties);
telemetry.Flush();

Flush needs to be called at the end to ensure that the data is sent to Log Analytics. In the code above you can see that I’ve added a CustomerId, OrderId and InvoiceId to the log properties and pass the log properties to each of the telemetry calls. Each of the logs will contain the properties that were set at the time of logging. I’ve generally wrap all this code so that I do not have to pass in the log properties into each call. I can add to the log properties whenever I have new properties and then each of the telemetry calls will include the log properties.

When we look at the logs via log analytics will can see the additional properties on the logs and then use them in our queries.

image

image

The log properties appear in customDimensions and you can see how the invoice log has the invoice id as well as the customer id and order id. The order log only has the customer id and order id.

You can add the custom dimensions to your queries as follows:

union traces, customEvents, exceptions

|order by timestamp asc

| where customDimensions.CustomerID == "e56e4baa-9e1d-4c3c-b498-365bf2807a5f"

You can also see in the logs the severity level which allows you to filter your logs to a sensible level. You need to plan your logs carefully and set an appropriate level to stop you flooding your logs with unnecessary data until you need it.

I’ve now shown you how to add logs to your application. You can find out more about the other methods available on the telemetry api here

Refining your Azure Log Analytics Queries

This is part 2 of a series of post about Log Analytics in Azure. In Part 1 I discussed how to access log analytics and use it to query your Exceptions. I also showed you how to display your output as a graph.

In this post we will look at some other tables, how we can view them and how we can refine the details we want to view.

I’ve been using Application Insights in my code to add my application logs and these log into a number of different tables depending upon which API call is used.

If you look at the tables we have with Application Insights, you can see that as well as exceptions there are a number of other tables

image

The ones I am interested in are traces, custom events and exceptions. Traces is used for general logging, custom events are used to indicate something has happened, for example, The start and end of some activity. Exceptions are used when something has gone wrong. You can query each of these tables separately.

image

image

image

What you can see with these three logs is that we can easily retrieve the data but it would be useful if it could be done in one query. For that you need to use the “union” keyword as follows:

union traces, exceptions, customEvents

| where customDimensions.Source <> "ApplicationInsightsProfiler"

Note, I need to add in the where clause as the ApplicationInsights Profiler is enabled on my site and I am not currently interested in those logs

If you run this query you will get a snapshot of the data in each of the table which is not always that useful

image

What would be useful is if I could order the logs by the timestamp.

To do this add another pipe and use the “order by” keywords and pick the “timestamp” column. I’ve added “asc” as I want to show my oldest log first. You can reverse it by using “desc” instead.

union traces, exceptions, customEvents

| where customDimensions.Source <> "ApplicationInsightsProfiler"

| order by timestamp asc

image

Now my logs are in a sensible order and I can see what is happening. The issue I have now is that I’ve got too much information on the screen to be able to view everything I need, plus the different tables have information in different columns. You can see with the events that the details do not appear in the message column making it difficult to view the event details. In order to control what I see I can use projection.This is achieved using the “project” keyword. To make best use of “project” you need to identify the columns of interest in each of the table we are using. Projection also allows you to order the columns. The order of the columns after “project” is the order they will appear in the results

union traces, exceptions, customEvents

| where customDimensions.Source <> "ApplicationInsightsProfiler"

| project timestamp, itemType, name, message, problemId, customDimensions

|order by timestamp asc

“timestamp” is the date/time of the log

“itemType” will show trace, customEvent or exception

“Name” contains the name of the custom event

“message” contains the details of the trace

“problemId” shows the top level details of the exception and custom

“customDimensions” shows custom properties that have been attached to the log

This results in the following log output:

image

You can see now that the logs are in a more usable format and I can drill down a little by clicking on the > next to the log. By using projection however you will limit the columns that are returned. If you need to drill down to get information you have filtered out, then you will need to run a different query. One example of this is when you get an exception, This projection will only give you the problemId so you will need to run a query on the exceptions table to bring back all the exceptions details.

In my next post I will show you how to use custom logging in your code with Application Insights.

Querying Exception Logs in Azure Log Analytics

In a previous post I’ve talked about how you can add logs to Azure Log Analytics. This post is about how you can make use of that logging . The key to Log Analytics (once your log data is in) is its query language.

You can navigate to Log Analytics from the Azure Portal. I’m using Application Insights for the examples and you can get to Log Analytics from the menu bar or by clicking search in the left hand panel and then Log analytics

image

image

Once in Log Analytics there will be an area for queries

image

An area for your data sources

image

and a query explorer where you can find queries that you or your team have saved previously.

The data sources section is a useful place to start because double clicking a data source will add it to the query. So starting with double clicking “exceptions” the press the Run button. This will query the exceptions logs and return all the exception logs that happening in the last 24 hours (as indicated by the time range next to the run button). If you want to add a time period to your query so that you can use it in a dashboard for example. There are some date functions to help. If you are unsure about how to add query parameters then you can go to the data that is returned and click the plus button next to the item you want to add to your query as below:

image

This will make the query look as follows:

exceptions

| where timestamp == todatetime('2019-06-26T18:21:49.1473946Z')

This is useful as you can add in >= to the query to find all logs that happened after this time but if you want to get all logs that happened over a specific period you can use the DateTime functions by typing a space after the greater than sign and see a list of the available functions

image

I use the “ago” function which also has help tips once you select it

image

As you can see there are examples for minutes, hours and days.

Queries are also built up using the pipe symbol so you can easily append.

If you want to summarise your data so you can get a count of each of the exceptions then you add a new pipe using the summarize keyword and the count function.You need to tell the query which property you wish to count. If you look at the “filter on” screen shot above you will see that there is a type property in the log record. If we summarize that property with count then the query will return all the exceptions in the timeframe and how often they have occurred

image

The query language also has a use “render” keyword that allows you to return the query in a variety of graphs

image

So the final query looks like this

exceptions

| where timestamp > ago(70d)

| summarize count() by type

| render piechart

image

Clicking the save button allows you to save your queries so that you can use them later or share them with other uses who share the same log analytics instance

image

In my next post I will show how you can use some of the other log tables, ordering and selecting the columns you wish to display

Using Azure DevOps to Restart a Web App

Recently I had an issue with one of the web sites I was supporting and it seemed to be falling over each night and it was difficult to work out what was wrong. Whilst I was working it out I need a mechanism to restart the website over night so that I could then take the time to figure out exactly what was wrong. There were a number of ways to achieve this but the simplest one for me was to use an Azure DevOps Release pipeline triggered on a schedule. The Azure DevOps “Azure App Service Manage” task allows me to achieve this.

image

To get started create a new release pipeline with an Empty job

image

Click on the “1 job, 0 task” link and then click on the “+” in Agent Job.

image

Enter “App service” in the search box and select “Azure App Service Manage” from the list of tasks that appear and click “Add”.

image

The task will default to Swap Slots but you can change this. Select your Azure Subscription and click “Authorize” if you haven’t already authorised your Azure Subscription.

image

Clicking “Authorize” will take you through the sign in process where you will need to enter your username and password for the Azure subscription that contains your app service. Once authorised select the Action you want to perform. Currently the list contains:

image

Select “Restart App Service” then pick your app service from the “App Service name” list, Also change the display name as it defaults to “Swap Slots:”

image

Your pipeline is now configured to restart your app service.

image

You now need to trigger this. Click on the pipeline tab

image

Then click on the Schedule button

image

Enable the trigger and select your desired schedule, edit the release pipelines title and click save. Your web site will now restart based upon the schedule you picked.

You can restart multiple web apps with a single release pipeline

image

You are able to chain each website or do it in parallel by changing the pre-deployment conditions:

image

To chain them select “after stage” and in parallel select “after release” for each stage.

When the schedule is run a new release is created and the web apps will restart and you will be able to see the status of each attempt in the same way you do with your standard releases.

Adding Security Policies To Azure API Management

The Azure API Management service allows you to publish your APIs both internally and externally and to control who and what can access them. Out of the box you will get a standard API key for each of you users who sign up to the API, but this is often not enough meet the security requirements for you or your partners. API Management allows you to add a more fine grained security model you each of your APIs and this can be done using the policy feature. Policies are used for more than just security and there are numerous policies that allow you to change the behaviour of your API through configuration. Documentation for the types of policies can be found here. Sample policy examples can be found here.

Two policies that I am going to discuss here will allow you to restrict access to your API through IP Whitelisting and through validating JWT claims. I will also discuss how you can put different controls onto your API for different partners.

Policies can be set at different levels and the documentation will highlight the areas where they are applicable. For security policies I am going to talk about protecting at the API level and at the product level. Adding a policy at the API level will be applicable to all subscribers to the API whereas adding the policy at the product level will be applicable to all subscribers to the product. A product can contain multiple APIs and and API can be in multiple products. So we can add in protection at either level depending upon what your exact requirements are. The policies are the same but their impact will depend upon where they are applied.


Lets start with API level policies. To add or edit policies then you need to navigate to your API in the Azure Management portal. Then click on the API option, then click on the API you wish to protect

image

The easiest way to add a policy is to click the Add Policy link in the inbound section.

image

Click Filter IP Addresses and Add IP Filter

image

This form allows you to add ranges or single IP addresses to both allow or deny.When you have finished click Save.

You will now see the policy in the policy editor view. If you are happier to add this in manually or want to copy this and version control the config then you can access this via the Code Editor menu on the Inbound processing policies box

image

image

Appling this policy on the API means that only IP addresses within this range can access this specific API and can be useful to ensure that this specific API is blocked from being accessed regardless of the product has been subscribed to. Its also useful if you want to block access from specific IP addresses. However, you may have different partners who have different security arrangements or that you want to give different permissions to . To allow for this you will need to add the policy at the product level.

To edit the policy at the product level, click Products, pick the product you want to secure.

image

In this example I have a new More Secure API that I’ve created and there’s an access control section which allows you to pick the users who have access to this API

image

So I’ve immediately blocked access to this API to guest users and we can add user authentication to  the API if we want, such as OAuth 2.0 and OpenID connect.

However, this post is talking about adding security policies and if we want to allow only specific IP addresses to access this API we can edit the policy at the Product level. To access the policy definition click Policies

image

You’ll notice that this is just the editor view and the easiest way is to add the policy at the API level using the wizard and copy the config to here. Products are a mechanism to allow you to group and protect APIs which means that from a management point of view you could create a product for each of your partners making it easier to maintain the security details for each and make it easier to disable access and remove only the security policies that apply to the specific partner. Managing this at the API level means that you will end up with a large number of security policies relating to a large number of partners making it difficult to manage. Security polices at the Product level are more important when you want to do some specific protection like checking claims in a signed JWT. The Product level policy allows you to have different signing keys for each product meaning that you can have different signing keys for each of your partners (assuming one product per partner).

image

This policy requires a JWT signed with the key eW91ci0yNTYtYml0LXNlY3JldA== and that also has the claim admin=true. If there is an error then 401 is returned with the message “You have failed the security checks please contact your administrator”

To summarise, we can add policies at both API and product level. Product level polices allow us to create a new product for each of our partners and then add specific security policies to the product tailored to our specific partners needs. The product level policy makes it easier to manage the security policies at a partner level but we can allso add global security policies at the API level such as blocking access from certain IP address ranges. Policies can do a lot more than security so check out the links at the start of the post for further information

My Video Library

Introduction to Azure Machine Learning Studio – Video walk through recorded March 2019

Introduction to Azure Log Analytics – Recorded at Dot Net Sheffield November 2018

Azure Machine Learning for Developers – Recorded at Dot Net Sheffield November 2018

Introduction to Microsoft Flow – Video walk through recorded September 2018

Easy Integration with Flow and Logic Apps – Recorded at Dot Net Sheffield August 2018

Add Existing Logs to Azure Log Analytics – Video walk through recorded June 2018

Visual Studio Team Service Load Testing – Video walk through recorded April 2018

Introduction to Azure Service Fabric – Recorded at Dot Net Sheffield March 2017

Building Scalable and Resilient Web Apps with Microsoft Azure – Recorded at Dot Net Sheffield March 2017

Service Fabric for the Microservices Win, baby! – Recorded at Microsoft’s UK TechDays Online Sept 2016

Adding existing logs to Log Analytics

I created a video to walk you through how to add existing logs to Log Analytics. There have been some changes to the way you do this.

The location of the settings to configure this has now move to Log Analytics in the Azure Portal. Previously, this was in the Operations Management Suite (OMS).

Logon to your Azure Portal (https://portal.azure.com) and click through to your log analytics workspace.  Then click on Advanced Settings

image

The Advanced Settings page will allow you to configure your data sources and where your logs will be pulled from. The rest of the video is the same.

image

Using Azure Logic Apps to Import CSV to SQL Server

When Logic Apps first came out I wrote a blog post explaining how to convert a CSV file into XML.A lot of this is still relevant, especially the integration account and the schemas and maps that are in my github repo. This post will show how Logic Apps are now even simpler to use with flat file decoding and also show how to insert the CSV data into a SQL server. The SQL part of the blog was adapted from this post: https://pellitterisbiztalkblog.wordpress.com/2016/11/14/upload-flat-file-on-azure-sql-database-using-azure-logic-app/

Logic Apps has evolved since I last wrote about this topic and you now no longer need to create a function to transform our csv to xml.

clip_image001

The Transform XML connector is used now with the same maps we used in the previous post

In order to add the individual rows to the database there are a number of things you need to do. We will use an XML schema mapping in a stored procedure to extract the data from the transformed xml.

In your SQL database you will need to add a stored procedure, table and an XML schema, The SQL Scripts to create the table, stored procedure and xml schema have been added to the github repo. The stored procedure takes the xml file that has been transformed and uses the xml schema to extract the firstname, middlename and surname from the xml and then store the data in the employees table. In the logic app you need to add a SQL server connector and configure the connection to your Azure SQL database and also add in the stored procedure with the parameter as the output from the Transform XML.

image

The only other thing I needed to do to get this working was to remove the first row of the csv file as it contained the header fields and I didn’t want that inserted into the database.

image

The “length” expression is:  length(variables('csvdata'))

image

The “indexOf” expression is: indexOf(variables('csvdata'),'\r\n')

However if you add this in the editor the back slash will be delimited and you will end up with \\r\\n which will not work. To fix this you will need to click the View Code button, search for the \r\n and remove the extra back  slash

The “substring” expression is: substring(variables('csvdata'),add(variables('firstnewlineposition'),2),sub(variables('csvlength'),add(variables('firstnewlineposition'),2)))

The trigger for my Logic App was when a new file was added to OneDrive, so click the run button and then drop a file into the configured OneDrive location and the csv entries should be added to your database.

Cloud Load Testing Behind a Firewall with Visual Studio Team Services

Recently I’ve been looking at how we can load test one of our services so that we are able to understand the load our partners can put onto our systems before we start to have any issues. We used the Cloud-based Load Testing (CLT) service of Visual Studio Team Services (VSTS). I created a short video showing you how to easily setup a url based load test. The next stage of our load testing was to load test the service that our partners provide, Their service required IP whitelisting to connect which meant the CLT service would not be able to connect. Luckily for us the CLT service allows you to deploy agents into your own infrastructure  to carry out the load testing and they are controlled by the same CLT service that we used to load test our own service. This blog post will show you how to install the agent and configure the load test for this scenario.

The load test agent is installed using a PowerShell script which can be obtained from here. Open the PowerShell as administrator and don’t forget to unblock the script

clip_image001

To enable you to run the script and to configure the agents to talk to the CLT service, you will need to create a PAT token in VSTS.

Login and click on your user icon, then select Security

clip_image001[5]

Select Personal Access Tokens, then Add

clip_image001[7]

Fill in the form and click Create Token at the bottom of the page

clip_image001[9]

This creates your token and this is the only time you will be able to access the token

clip_image001[11]

You need to make sure that you copy it now as it you will not be able to access it after you have left the page,

Gong back to PowerShell, run the following command

.\ManageVSTSCloudLoadAgent.ps1 -TeamServicesAccountName StevesVSTS -PATToken 37abawavsmsgj6hpakltwhdjt4jrqsmup2jx62hlcxbju2l2tbja -ConfigureAgent -AgentGroupName StevesInternalTest

This will take a few minutes to run. If you didn’t run PowerShell as an Administrator you might see errors. When it has run the VSTSLoadAgentService should be installed and running

clip_image001[13]

Now need to configure a load test. Following on from my video, you can create a url test

clip_image001[17]

I ran a test web app in Visual Studio using localhost as the address

clip_image001[19]

When the test has been created select the Settings tab, click “Use self-provisioned agents” and select your agent from the list and add the number of agents you want to use. You could install the agents on a number of machines in your environment using the same script, then you will be able to add more than 1 agent if required. As I only installed the one agent I can only select 1. You can see how many agents the CTL service can see

image

If there are less than you think you will need to check to make sure the service was installed without error and that it is running 

Save the load test and run it.

clip_image001[23]

Whilst the test was running the performance meters in Visual Studio showed that the web page was being loaded.

When the test is complete you should see that it has not cost you any VUM (Virtual User Minutes) as the load tests are running on your own agents

clip_image001[21]

The Cloud Load Test service allows you to load test both publicly accessible and private websites and services. As long as the servers running the load test agents have outbound access to the internet for HTTPS then we are able to load test private sites and services and the load test does not cost anything apart from the cost of the infrastructure that the agents are running on locally.