This is part 2 of a series of post about Log Analytics in Azure. In Part 1 I discussed how to access log analytics and use it to query your Exceptions. I also showed you how to display your output as a graph.
In this post we will look at some other tables, how we can view them and how we can refine the details we want to view.
I’ve been using Application Insights in my code to add my application logs and these log into a number of different tables depending upon which API call is used.
If you look at the tables we have with Application Insights, you can see that as well as exceptions there are a number of other tables
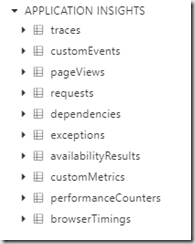
The ones I am interested in are traces, custom events and exceptions. Traces is used for general logging, custom events are used to indicate something has happened, for example, The start and end of some activity. Exceptions are used when something has gone wrong. You can query each of these tables separately.
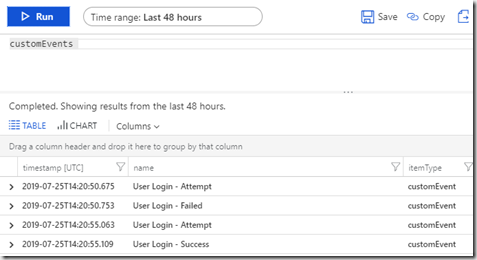
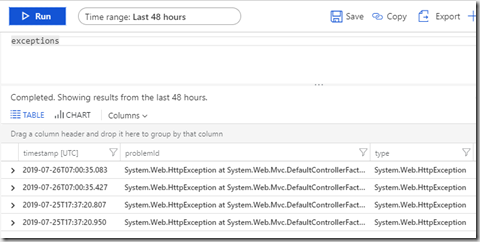
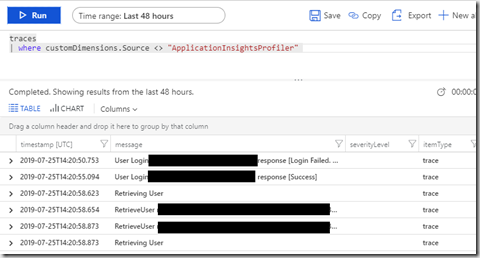
What you can see with these three logs is that we can easily retrieve the data but it would be useful if it could be done in one query. For that you need to use the “union” keyword as follows:
union traces, exceptions, customEvents
| where customDimensions.Source <> "ApplicationInsightsProfiler"
Note, I need to add in the where clause as the ApplicationInsights Profiler is enabled on my site and I am not currently interested in those logs
If you run this query you will get a snapshot of the data in each of the table which is not always that useful
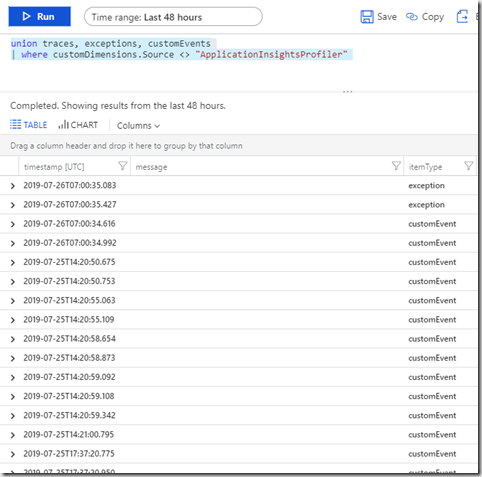
What would be useful is if I could order the logs by the timestamp.
To do this add another pipe and use the “order by” keywords and pick the “timestamp” column. I’ve added “asc” as I want to show my oldest log first. You can reverse it by using “desc” instead.
union traces, exceptions, customEvents
| where customDimensions.Source <> "ApplicationInsightsProfiler"
| order by timestamp asc
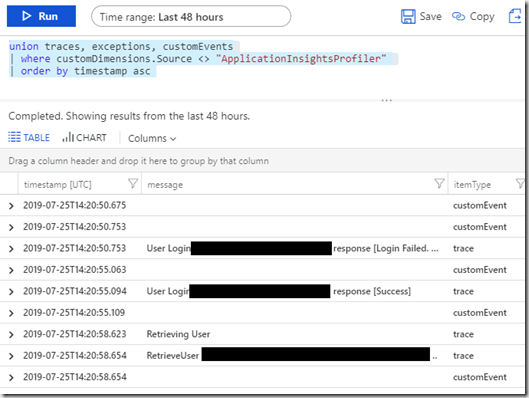
Now my logs are in a sensible order and I can see what is happening. The issue I have now is that I’ve got too much information on the screen to be able to view everything I need, plus the different tables have information in different columns. You can see with the events that the details do not appear in the message column making it difficult to view the event details. In order to control what I see I can use projection.This is achieved using the “project” keyword. To make best use of “project” you need to identify the columns of interest in each of the table we are using. Projection also allows you to order the columns. The order of the columns after “project” is the order they will appear in the results
union traces, exceptions, customEvents
| where customDimensions.Source <> "ApplicationInsightsProfiler"
| project timestamp, itemType, name, message, problemId, customDimensions
|order by timestamp asc
“timestamp” is the date/time of the log
“itemType” will show trace, customEvent or exception
“Name” contains the name of the custom event
“message” contains the details of the trace
“problemId” shows the top level details of the exception and custom
“customDimensions” shows custom properties that have been attached to the log
This results in the following log output:
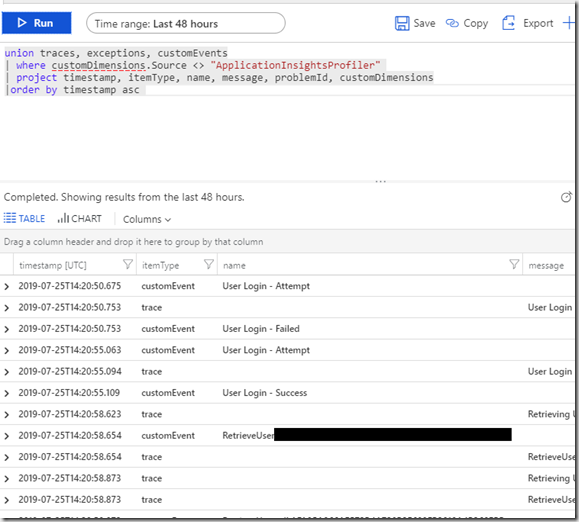
You can see now that the logs are in a more usable format and I can drill down a little by clicking on the > next to the log. By using projection however you will limit the columns that are returned. If you need to drill down to get information you have filtered out, then you will need to run a different query. One example of this is when you get an exception, This projection will only give you the problemId so you will need to run a query on the exceptions table to bring back all the exceptions details.
In my next post I will show you how to use custom logging in your code with Application Insights.