In a previous post I’ve talked about how you can add logs to Azure Log Analytics. This post is about how you can make use of that logging . The key to Log Analytics (once your log data is in) is its query language.
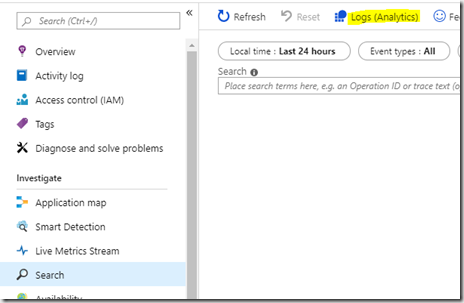
You can navigate to Log Analytics from the Azure Portal. I’m using Application Insights for the examples and you can get to Log Analytics from the menu bar or by clicking search in the left hand panel and then Log analytics

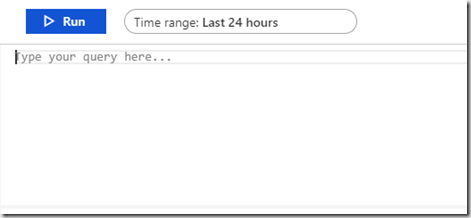
Once in Log Analytics there will be an area for queries
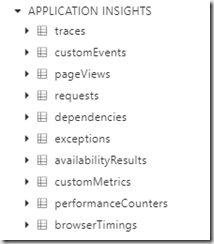
An area for your data sources
and a query explorer where you can find queries that you or your team have saved previously.
The data sources section is a useful place to start because double clicking a data source will add it to the query. So starting with double clicking “exceptions” the press the Run button. This will query the exceptions logs and return all the exception logs that happening in the last 24 hours (as indicated by the time range next to the run button). If you want to add a time period to your query so that you can use it in a dashboard for example. There are some date functions to help. If you are unsure about how to add query parameters then you can go to the data that is returned and click the plus button next to the item you want to add to your query as below:
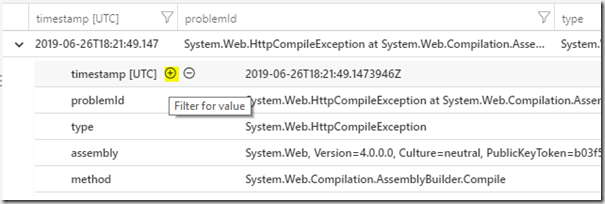
This will make the query look as follows:
exceptions
| where timestamp == todatetime('2019-06-26T18:21:49.1473946Z')
This is useful as you can add in >= to the query to find all logs that happened after this time but if you want to get all logs that happened over a specific period you can use the DateTime functions by typing a space after the greater than sign and see a list of the available functions

I use the “ago” function which also has help tips once you select it

As you can see there are examples for minutes, hours and days.
Queries are also built up using the pipe symbol so you can easily append.
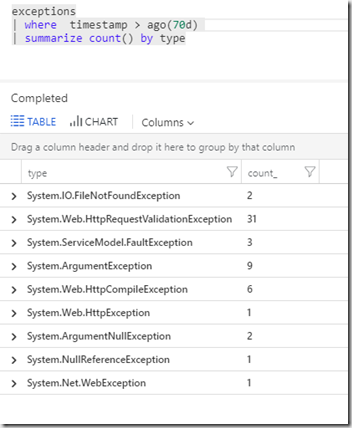
If you want to summarise your data so you can get a count of each of the exceptions then you add a new pipe using the summarize keyword and the count function.You need to tell the query which property you wish to count. If you look at the “filter on” screen shot above you will see that there is a type property in the log record. If we summarize that property with count then the query will return all the exceptions in the timeframe and how often they have occurred
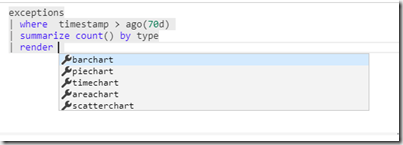
The query language also has a use “render” keyword that allows you to return the query in a variety of graphs
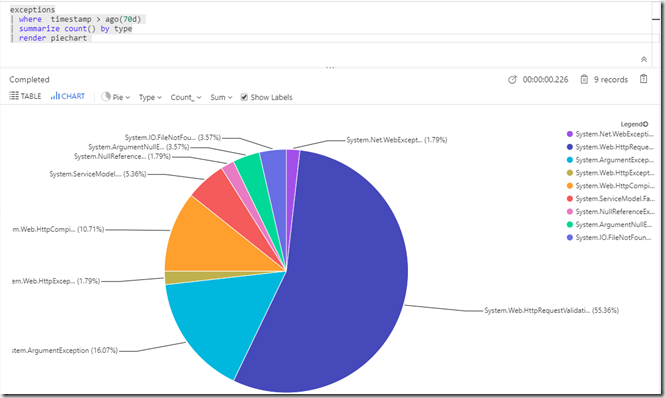
So the final query looks like this
exceptions
| where timestamp > ago(70d)
| summarize count() by type
| render piechart
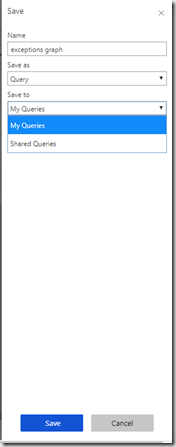
Clicking the save button allows you to save your queries so that you can use them later or share them with other uses who share the same log analytics instance
In my next post I will show how you can use some of the other log tables, ordering and selecting the columns you wish to display