Steve Spencer's Blog

Blogging on Azure Stuff

Using the Azure Graph API Beta to add an Application Role Assignment

In an earlier post I talked about using Graph API to invite users using B2B and add them to groups. In this post I am introducing the Beta version of the API. This has additional functionality that is currently not released. Microsoft have provided documentation for the Graph API which currently defaults to V1.0. See https://docs.microsoft.com/en-us/graph/api/overview

To see the Beta documentation there is a version drop down list which allows you to select either V1.0 or the Beta version.

clip_image002

Just like the release version of Graph API you install the C# Graph API Beta using a nuget package: Microsoft.Graph.Beta

The code samples in here will work in both the Beta and released version but I wanted to show the difference between using the Beta API but also show you something you can use in production.

The scenario I am going to show is Adding a user to an Azure AD application.

First you will need a client to access the Beta Graph API. With the Beta API nuget package installed this automatically uses the Beta client.

ConfidentialClientApplicationOptions _applicationOptions = new ConfidentialClientApplicationOptions

{

        ClientId = ConfigurationManager.AppSettings["ClientId"],

        TenantId = ConfigurationManager.AppSettings["TenantId"],

        ClientSecret = ConfigurationManager.AppSettings["AppSecret"]

};

var confidentialClientApp = ConfidentialClientApplicationBuilder

                                                .CreateWithApplicationOptions(_applicationOptions)

                                                .Build();

ClientCredentialProvider authProvider = new ClientCredentialProvider(confidentialClientApp);

GraphServiceClient betaGraphClient = new GraphServiceClient(authProvider);

This creates a Beta graph client with application scope.

To add an application role assignment to a user we need access to the Service Principles endpoint. Looking at the API documentation for List Service Principles we need an Application permission of Directory.ReadAll,

clip_image004

Create and Update Service Principles requires Directory.ReadWriteAll

clip_image006

We can to add the permission to the Graph API application of Directory.ReadWriteAll and Grant Admin consent to the permissions we set up in the previous post. This will also cover the List API call.

clip_image008

Without these permissions adding any calls to the Service Principle endpoint would return unauthorised.

In order to add an application role assignment we need to first obtain the user:

var user = (await betaGraphClient.Users.Request(options)                                                         

                            .Filter($"mail eq '{testUserEmail}'")

                           .GetAsync()).FirstOrDefault();

Then find all the app role assignments for the application we are interested in to see if the user is already assigned. To get the role assignments we call the service principle endpoint and expand the approleassignedto property:

var app1ServicePrincipals = await betaGraphClient.ServicePrincipals

                                                                .Request()

                                                                .Filter($"appId eq '{testApp1}'")

                                                                .Expand("approleassignedto")

                                                                .GetAsync();

var app1RoleAssignment = (from ra in app1ServicePrincipals[0].AppRoleAssignedTo

                                             where ra.PrincipalId.ToString() == user.Id

                                             select ra).FirstOrDefault();

If we want to remove the role assignment then we call the DeleteAsync method.

if (app1RoleAssignment != null)

{

        await betaGraphClient.ServicePrincipals[app1ServicePrincipals[0].Id]

                                               .AppRoleAssignedTo[app1RoleAssignment.Id]

                                               .Request()

                                               .DeleteAsync();

}

To Add a role assignment to the application call the Add endpoint:

app1RoleAssignment = new AppRoleAssignment

                                      {

                                           CreationTimestamp = DateTimeOffset.Now,

                                           PrincipalDisplayName = user.DisplayName,

                                           PrincipalId = Guid.Parse(user.Id),

                                           PrincipalType = user.UserType,

                                           ResourceDisplayName = app1ServicePrincipals[0].DisplayName,

                                           ResourceId = Guid.Parse(app1ServicePrincipals[0].Id),

                                           AppRoleId = Guid.Empty

                                      };

await betaGraphClient.ServicePrincipals[app1ServicePrincipals[0].Id]

                                                                 .AppRoleAssignments

                                                                .Request()

                                                                .AddAsync(app1RoleAssignment);

To see the role assignments that the user now has find all the appRoleAssignments that contain the users id:

var roleAssignments = servicePrincipals.SelectMany(x => x.AppRoleAssignedTo).ToList();

var appRoleAssignments = from ra in roleAssignments

                                            where ra.PrincipalId.ToString() == user.Id

                                            select ra;

foreach (var ra in appRoleAssignments)

{

        Console.WriteLine($"[{ra.PrincipalDisplayName}] [{ra.ResourceDisplayName}]");

}

This should show the same information you can see when you look in Azure AD at the User’s applications:

clip_image010

Features and tools may change between Beta and Production. The code above changed slightly when moving to productions but the easiest way to see is to remove the Beta nuget and add the production one. The only change I had to make was to change the CreationTimeStamp to CreatedDateTime = DateTime.Now.

Information about which features are in Beta and which are in production can be found here: https://docs.microsoft.com/en-us/graph/whats-new-overview

Using Graph API to automate Azure AD

In my previous posts I discussed how you can manage access to applications (part 1) using Azure AD and also how you can add users users from outside of your organisation (part 2). Now we will look at how you can automate this using Graph API.

“The Microsoft Graph API offers a single endpoint, https://graph.microsoft.com, to provide access to rich, people-centric data and insights exposed as resources of Microsoft 365 services. You can use REST APIs or SDKs to access the endpoint and build apps that support scenarios spanning across productivity, collaboration, education, security, identity, access, device management, and much more.” - https://docs.microsoft.com/en-us/graph/overview

From the overview you can see that Graph API covers a large area of Microsoft 365 services. One of the services it covers is Azure AD. What I’ll show you today is how to invite users and then add/remove them to/from groups using Graph API.

There are two ways to access Graph API. A user centric approach (Delegated) that requires a user account and an application centric approach that uses an application key and secret. Accessing Azure AD for user invite and group management utilises the application centric approach. In order to get an application id and secret you will need to create an application in Azure AD. The first post in the series talks about how to create an App Registration.

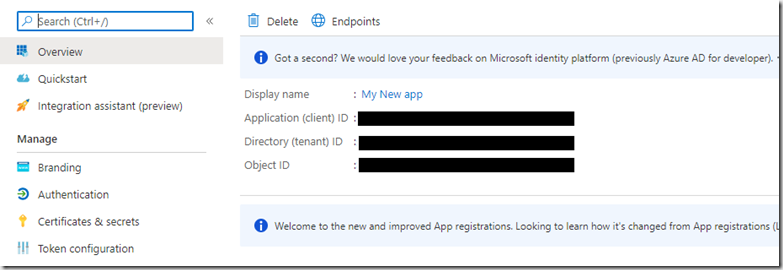
Once you have created your application, there are a couple of bits of information you require in order to get started. These are the tenantId and clientId. These can be found in the Azure portal. Navigate to your App Registration and the details can be found in the Overview blade.
image

If you hover over each of the Guids a copy icon appears to allow you to easily copy these values.

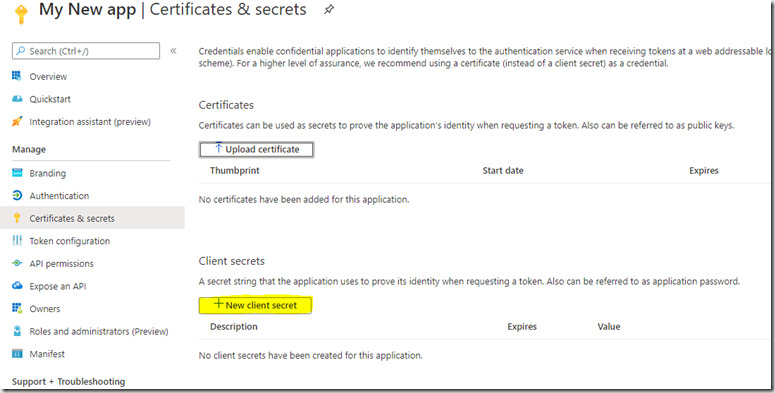
Next you will need a key generating. For this you click on the Certificates and secrets blade.
image

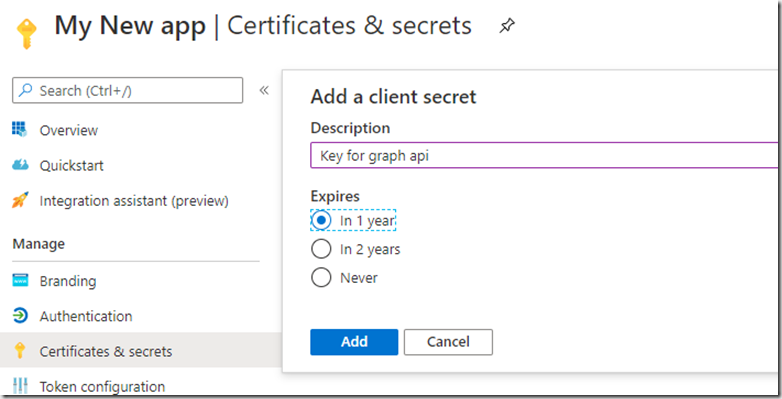
Then click “New client secret” and populate the form and click “Add”
image

Your key will now appear.

image

Make sure you copy this as it is not visible again once you navigate away and you will need to generate a new one.

image

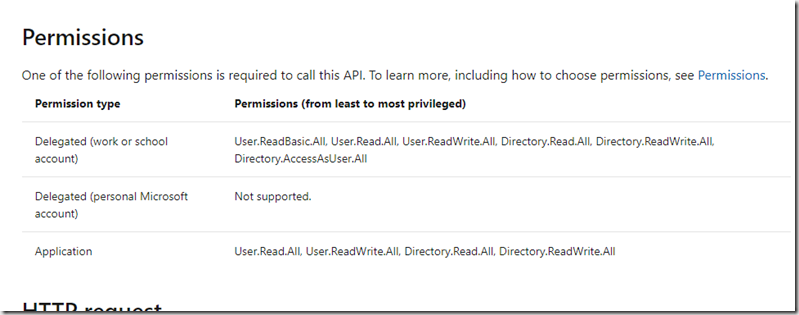
We are now ready to start looking at Graph API. There is good documentation about each of the functions in Graph API including the permissions required to access and code samples in a variety of languages. If we look at the list User function:

https://docs.microsoft.com/en-us/graph/api/user-list?view=graph-rest-1.0&tabs=http
image

You can see the permissions needed to access this function. As we are using an Application permission type we need to set one of the permissions: User.Read.All, User.ReadWrite.All, Directory.Read.All or Directory.ReadWrite.All.

You can set the permissions required by going to your App Registration and clicking on the “API permissions”
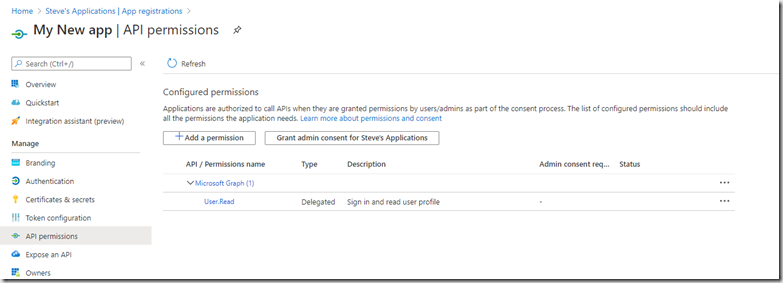
image

The application by default requires a user login that can read their own user profile. We need to add some additional permissions to allow our application to list the users in AD.Click on “Add permission”

This shows the list of built-in API’s that you can access. We are only looking at Microsoft Graph today
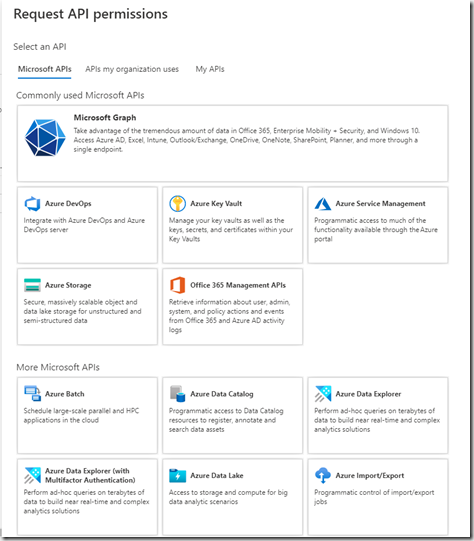
image

Click “Microsoft graph”

image

Then “Application permission” and scroll to the User section
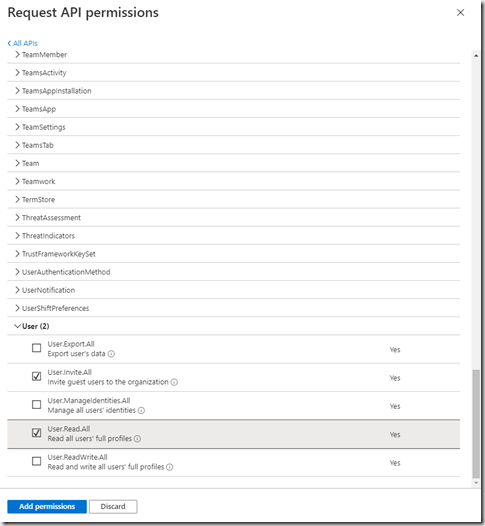
image

To list users we need the User.Read.All permission, but we’ll also add the User.Invite.All so that we can invite B2B users. click “Add permissions”.
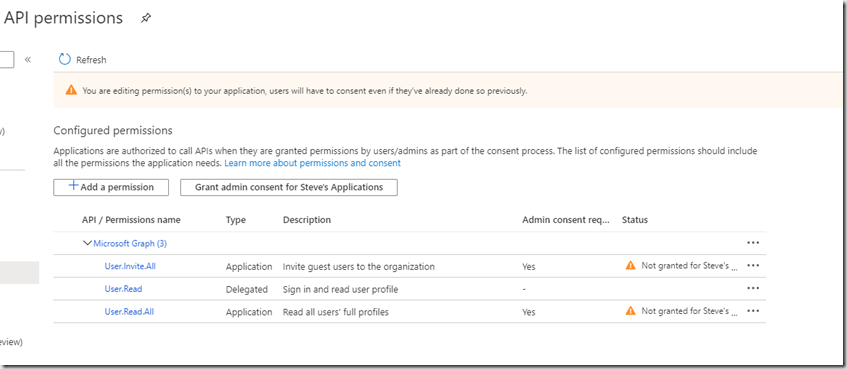
image

Although you have added the permissions you cannot currently access the Graph API as you will need to Grant admin consent in first. If we had  added a Delegated permission then the user could try an access the Graph API but Admin consent would be required to stop anyone from accessing certain features. This can be done in a workflow with selected Admins being notified of access. Before the use can access an Administrator would need to approve each access. This process will not work for our application as it is an unattended application using the application permission type. We can however grant access to this application user by clicking “Grant admin consent …” button and clicking Yes to the message box that pops up.
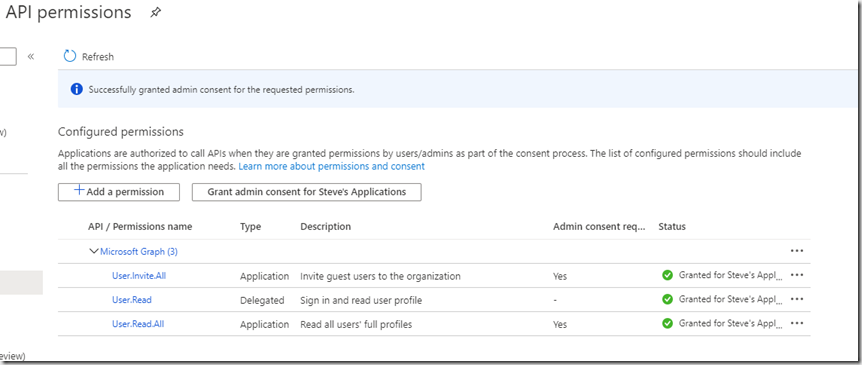
image

Clicking the button adds admin consent to all permissions. If you want to remove it from any, click the ellipsis (…) at the end and click “Revoke admin consent”

image

You can also remove permissions from this menu.

Your user is now ready to go. I’m using the C# SDK and this is available as a nuget package

Once the nuget package is installed. You will need to create an instance of the Graph API client:

ConfidentialClientApplicationOptions _applicationOptions = new ConfidentialClientApplicationOptions
{
     ClientId = ConfigurationManager.AppSettings["ClientId"],
     TenantId = ConfigurationManager.AppSettings["TenantId"],
     ClientSecret = ConfigurationManager.AppSettings["AppSecret"]
};


// Build a client application.
IConfidentialClientApplication confidentialClientApplication = ConfidentialClientApplicationBuilder
                 .CreateWithApplicationOptions(_applicationOptions)
             .Build();


// Create an authentication provider by passing in a client application and graph scopes.
ClientCredentialProvider authProvider = new ClientCredentialProvider(confidentialClientApplication);


// Create a new instance of GraphServiceClient with the authentication provider.
GraphServiceClient graphClient = new GraphServiceClient(authProvider);

You will need the ClientId, TenentId and Secret you copied earlier. Looking at the Graph API documentation there are example of how to use each of the functions.
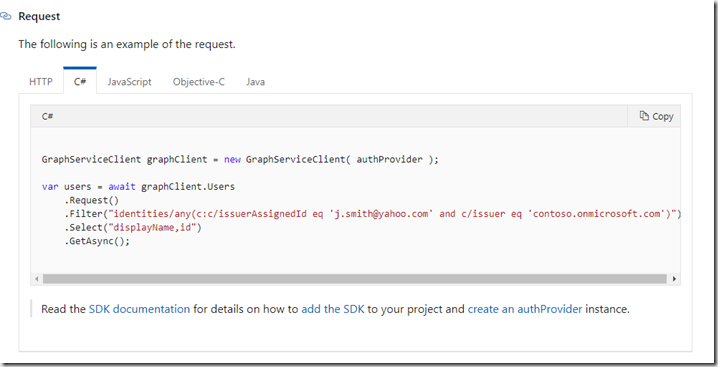
image

We want to see if a user existing in our AAD before we invite them, so we will use the filter option as above.

var user = (await graphClient.Users
                 .Request(options)
                 .Filter($"mail eq '{testUserEmail}'")
                 .GetAsync()).FirstOrDefault();

Console.WriteLine($"{testUserEmail} {user != null} {user?.Id} [{user?.DisplayName}] [{user?.Mail}]");

If user is null then is does not exist in your AzureAD tenant. Assuming that this is an external user then you will need to invite the user to be able to access your application. I created a method for this:

private async Task<Invitation> InviteUser(IGraphServiceClient graphClient, string displayName, string emailAddress, string redirectUrl, bool wantCustomEmaiMessage, string emailMessage)
{
     // Needs: User.InviteAll

    var invite = await graphClient.Invitations
                     .Request().AddAsync(new Invitation
                     {
                         InvitedUserDisplayName = displayName,
                         InvitedUserEmailAddress = emailAddress,
                         SendInvitationMessage = wantCustomEmaiMessage,
                         InviteRedirectUrl = redirectUrl,
                         InvitedUserMessageInfo = wantCustomEmaiMessage ? new InvitedUserMessageInfo
                         {
                             CustomizedMessageBody = emailMessage,
                         } : null
                     });

    return invite;
}

Now you’ve just invited a B2B user into your Azure AD tenant. At the moment they do not have access to anything as you’ve not assigned them to any application. The Graph API for assigning users to applications uses the delegated permissions model which means you need to use an actual user account. The Graph API with the application permission model does not support adding users to applications. In order to use the same application client you used for inviting users, you could assign a group to your application and then use the Graph API to add/remove users to/from that group.

Adding/removing a user to/from a group requires one of the following permissions: GroupMember.ReadWrite.All, Group.ReadWrite.All and Directory.ReadWrite.All. This is set in the same way as for the user permissions in the App Registration/Api permission section mentioned earlier. Admin consent will also need to be granted for these permissions.

The code to add & remove users is below:

// find group
var groupFound = (await graphClient.Groups
                                         .Request()
                                         .Filter($"displayName eq '{groupName}'")
                                         .Expand("members")
                                         .GetAsync()).FirstOrDefault();

Console.WriteLine($"{groupName} {groupFound != null } [{groupFound?.Id}] [{groupFound?.DisplayName}] [{groupFound?.Members?.Count}]");

if (groupFound != null)
{
     // check is the user is already in the group
     var user = (from u in groupFound.Members
                 where u.Id == user.Id
                 select u).FirstOrDefault();
     Console.WriteLine($"user Found {user != null}");

    if (user != null)
     {
         Console.WriteLine($"removing user {user.Id}");
         // remove from group
         await graphClient.Groups[groupFound.Id].Members[user.Id].Reference
                                     .Request()
                                     .DeleteAsync();

    }
     else
     {
         Console.WriteLine($"adding user {user.Id}");
         // add to group
         await graphClient.Groups[groupFound.Id].Members.References
             .Request()
             .AddAsync(new DirectoryObject
             {
                 Id = user.Id
             });
     }
}

In the code above I wanted the Graph API to return me the list of users in the group. By default you do not see this data when retrieving group information. Adding the Expand method tells Graph API to extend the query and return the additional data. This is something to bear in mind when using Graph API. Just because the data is null does not mean that there is no data, you might need to expand the data set returned.

I hope you found this a useful introduction to Graph API, I will be posting more on Azure AD in the future including more on Graph API.

Exporting Logs from Application Insights using Continuous Export

This is the fifth post of my series of posts about Log Analytics and Application Insights. The previous post talked about adding custom logging to you code using Application Insights. Now you’ve got your logging into Application Insights you can run log analytics queries and build dash boards, alerts etc. Sometime though you want to use this data in other systems and it would be useful if you could export the data and use it else where. This post will show you how you can regularly export the data from Application Insights into Azure Storage. Once it is in Storage it can easily be moved into other systems or used else where such as PowerBI. This can be achieved using the Continuous Export feature of Application Insights

To enable Continuous Export, login to the Azure management portal and navigate to Application Insights. Click on the instance you want Continuous Export enabled. The scroll down the options on the left until you find the Configure section and click on Continuous Export

image

To use Continuous Export you will need to configure a storage account. Click Add:

image

Click Data types to export:

image

I was only interested in the logs I emitted from my custom logging, so selected Custom Event, Exception and Trace then clicked OK

image

Next pick a storage location. Make sure you use one where your Application Insights instance is located otherwise you will be charged egress fees to move the data to a new datacentre.

image

You can now pick an existing storage account or create a new one. Upon selecting a storage account you can pick an existing  container or create a new one.Once a blob container is selected click OK.

Continuous Export is now configured. You will not see anything in the storage container until the next set of logs are sent to Application Insights.

My log analytics query shows the following logs have been generated:

image

If you look at the continuous Export configuration page you will see that the last updated date has changed.

image

Now look in blob storage. You should see a folder that is<ApplicationInsights_ServiceName>_<ApplicationInsights_InstrumentationKey

image

Click through and you will see a number of folders. One for each of the logs that I enabled when setting up Continuous Export. Click through one of them and you will see a folder for the date and then a folder for the hour of the logs. Then a file containing the logs for that hour.

image

You will get a row of json data for each row output for the log query. Note the whole logs emitted will be in each of the folders.

e.g.

{
     "event": [
         {
             "name": "Some Important Work Completed",
             "count": 1
         }
     ],
     "internal": {
         "data": {
             "id": "a guid is here",
             "documentVersion": "1.61"
         }
     },
     "context": {
         "data": {
             "eventTime": "2020-03-22T18:12:30.2553417Z",
             "isSynthetic": false,
             "samplingRate": 100.0
         },
         "cloud": {},
         "device": {
             "type": "PC",
             "roleInstance": "yourcomputer",
             "screenResolution": {}
         },
         "session": {
             "isFirst": false
         },
         "operation": {},
         "location": {
             "clientip": "0.0.0.0",
             "continent": "Europe",
             "country": "United Kingdom",
             "province": "Nottinghamshire",
             "city": "Nottingham"
         },
         "custom": {
             "dimensions": [
                 {
                     "CustomerID": "4df16004-2f1b-48c0-87d3-c1251a5db3f6"
                 },
                 {
                     "OrderID": "5440d1cf-5d06-4b0e-bffb-fad522af4ad1"
                 },
                 {
                     "InvoiceID": "a7d5a8fb-2a2e-4697-8ab4-f7bf8b8dbe18"
                 }
             ]
         }
     }
}

As the data is now out of Application Insights you can move it where ever you need it. You will also need to manage the blob storage data too otherwise you will end up with the logs stored in two places and the storage costs will be doubled.

One example of subsequent usage is exporting the data to Event Hub. As the data is in blob storage you can use a function with a blob trigger to read the blob in a row at a time and publish the data onto Event Hub:

[FunctionName("ContinuousExport")]
public static async void Run([BlobTrigger("logs/{name}", Connection = "ConitnuousExportBlobSetting")]Stream myBlob, string name,
     [EventHub("logging", Connection = "EventHubConnectionAppSetting")] IAsyncCollector<string> outputEvents,TraceWriter log)
{
     log.Info($"C# Blob trigger function Processed blob\n Name:{name} \n Size: {myBlob.Length} Bytes");
     StreamReader textReader = new StreamReader(myBlob);
     while (!textReader.EndOfStream)
     {
         string line = textReader.ReadLine();
         log.Info(line);
         await outputEvents.AddAsync(line);
     }
}

Note: This is an example, so will need additional code to make sure that you don’t exceed the Event Hub maximum message size

So with Continuous Export you can extract your log data from Application insights and move it to other systems for processing.

Adding Application Insights Logging to your code

This is the fourth of a series about Application Insights and Log analytics. I’ve shown you how to add existing logs, using the log analytics query language to view you logs and how to enhance your query to drill down and get to the logs you are interested in. This post is about how you can add logs from your code and provide the information to allow you refine your queries and help you to diagnose your faults more easily

If you don’t already have application insights then you can create a new instance in the Azure portal (https://portal.azure.com/)

Get your application insights key from the azure portal. Click on your application insights instance and navigate to the Overview section then copy your instrumentation key. You will need this in your code.

image

In your project, add application insights via nuget :

Install-Package Microsoft.ApplicationInsights -Version 2.10.0

In you code you need to assign the key to Application Insights as follows:

TelemetryConfiguration configuration = TelemetryConfiguration.CreateDefault();
configuration.InstrumentationKey = “put your key here”;

To log details using application insights then you need a telemetry client.

TelemetryClient telemetry = new TelemetryClient(configuration);

The telemetry client has a larger number of features than I am not going to talk about here as I am just interested in logging today. There are three methods of interest: TrackEvent, TrackException and TrackTrace.

I use TrackEvent to log out things like start and end of methods of if something specific occurs that I want to log; TrackException is for logging Exception details and TrackTrace is for everything else.

telemetry.TrackEvent("Some Important Work Started");
try {
     telemetry.TrackTrace("I'm logging out the details of the work that is being done", SeverityLevel.Information); } catch(Exception ex) {
     telemetry.TrackException(ex); } telemetry.TrackEvent("Some Important Work Completed");

You now have the basics for logging. This will be useful to some extent, but it will be difficult to follow the traces when you have a busy system with logs of concurrent calls to the same methods. To assist you to filter your logs it would be useful to provide some identifying information that you can add to your logs to allow you to track and trace calls through your system. You could add these directly to your logs but this then makes your logs bloated and difficult to read. Application Insights provides a mechanism to pass properties along with the logs which will appear in the  Log Analytics data that is returned from your query. Along with each log you can pass a dictionary of properties. I add to the set of properties as the code progresses to provide identifying information to assist with filtering the logs.I generally add in each new identifier as they are created. I can then use these in my queries to track the calls through my system and remove the ones I am not interested in. Diagnosing faults then becomes a lot easier. To make this work then you need to be consistent with the naming of the properties so that you always use the same name for the same property in different parts of the system. Also try and be consistent about when you use TrackEvent and TrackTrace. You can set levels for your traces based upon the severity level (Verbose, Information, Warning, Error, Critical)

TelemetryConfiguration.Active.InstrumentationKey = Key;
TelemetryClient telemetry = new TelemetryClient(); 
var logProperties = new Dictionary();

logProperties.Add("CustomerID", "the customer id pass through from elsewhere");

telemetry.TrackEvent("Some Important Work Started", logProperties);
try
{
      var orderId = GenerateOrder();
      logProperties.Add("OrderID", orderId.ToString());
      telemetry.TrackTrace("I just created an order", logProperties);

      var invoiceId = GenerateInvoice();
      logProperties.Add("InvoiceID", invoiceId.ToString());
      telemetry.TrackTrace("I've just created an invoice", logProperties);

      SendInvoice(invoiceId);
}
catch (Exception ex)
{
      telemetry.TrackException(ex, logProperties);
}
telemetry.TrackEvent("Some Important Work Completed", logProperties);
telemetry.Flush();

Flush needs to be called at the end to ensure that the data is sent to Log Analytics. In the code above you can see that I’ve added a CustomerId, OrderId and InvoiceId to the log properties and pass the log properties to each of the telemetry calls. Each of the logs will contain the properties that were set at the time of logging. I’ve generally wrap all this code so that I do not have to pass in the log properties into each call. I can add to the log properties whenever I have new properties and then each of the telemetry calls will include the log properties.

When we look at the logs via log analytics will can see the additional properties on the logs and then use them in our queries.

image

image

The log properties appear in customDimensions and you can see how the invoice log has the invoice id as well as the customer id and order id. The order log only has the customer id and order id.

You can add the custom dimensions to your queries as follows:

union traces, customEvents, exceptions

|order by timestamp asc

| where customDimensions.CustomerID == "e56e4baa-9e1d-4c3c-b498-365bf2807a5f"

You can also see in the logs the severity level which allows you to filter your logs to a sensible level. You need to plan your logs carefully and set an appropriate level to stop you flooding your logs with unnecessary data until you need it.

I’ve now shown you how to add logs to your application. You can find out more about the other methods available on the telemetry api here

Refining your Azure Log Analytics Queries

This is part 2 of a series of post about Log Analytics in Azure. In Part 1 I discussed how to access log analytics and use it to query your Exceptions. I also showed you how to display your output as a graph.

In this post we will look at some other tables, how we can view them and how we can refine the details we want to view.

I’ve been using Application Insights in my code to add my application logs and these log into a number of different tables depending upon which API call is used.

If you look at the tables we have with Application Insights, you can see that as well as exceptions there are a number of other tables

image

The ones I am interested in are traces, custom events and exceptions. Traces is used for general logging, custom events are used to indicate something has happened, for example, The start and end of some activity. Exceptions are used when something has gone wrong. You can query each of these tables separately.

image

image

image

What you can see with these three logs is that we can easily retrieve the data but it would be useful if it could be done in one query. For that you need to use the “union” keyword as follows:

union traces, exceptions, customEvents

| where customDimensions.Source <> "ApplicationInsightsProfiler"

Note, I need to add in the where clause as the ApplicationInsights Profiler is enabled on my site and I am not currently interested in those logs

If you run this query you will get a snapshot of the data in each of the table which is not always that useful

image

What would be useful is if I could order the logs by the timestamp.

To do this add another pipe and use the “order by” keywords and pick the “timestamp” column. I’ve added “asc” as I want to show my oldest log first. You can reverse it by using “desc” instead.

union traces, exceptions, customEvents

| where customDimensions.Source <> "ApplicationInsightsProfiler"

| order by timestamp asc

image

Now my logs are in a sensible order and I can see what is happening. The issue I have now is that I’ve got too much information on the screen to be able to view everything I need, plus the different tables have information in different columns. You can see with the events that the details do not appear in the message column making it difficult to view the event details. In order to control what I see I can use projection.This is achieved using the “project” keyword. To make best use of “project” you need to identify the columns of interest in each of the table we are using. Projection also allows you to order the columns. The order of the columns after “project” is the order they will appear in the results

union traces, exceptions, customEvents

| where customDimensions.Source <> "ApplicationInsightsProfiler"

| project timestamp, itemType, name, message, problemId, customDimensions

|order by timestamp asc

“timestamp” is the date/time of the log

“itemType” will show trace, customEvent or exception

“Name” contains the name of the custom event

“message” contains the details of the trace

“problemId” shows the top level details of the exception and custom

“customDimensions” shows custom properties that have been attached to the log

This results in the following log output:

image

You can see now that the logs are in a more usable format and I can drill down a little by clicking on the > next to the log. By using projection however you will limit the columns that are returned. If you need to drill down to get information you have filtered out, then you will need to run a different query. One example of this is when you get an exception, This projection will only give you the problemId so you will need to run a query on the exceptions table to bring back all the exceptions details.

In my next post I will show you how to use custom logging in your code with Application Insights.

Querying Exception Logs in Azure Log Analytics

In a previous post I’ve talked about how you can add logs to Azure Log Analytics. This post is about how you can make use of that logging . The key to Log Analytics (once your log data is in) is its query language.

You can navigate to Log Analytics from the Azure Portal. I’m using Application Insights for the examples and you can get to Log Analytics from the menu bar or by clicking search in the left hand panel and then Log analytics

image

image

Once in Log Analytics there will be an area for queries

image

An area for your data sources

image

and a query explorer where you can find queries that you or your team have saved previously.

The data sources section is a useful place to start because double clicking a data source will add it to the query. So starting with double clicking “exceptions” the press the Run button. This will query the exceptions logs and return all the exception logs that happening in the last 24 hours (as indicated by the time range next to the run button). If you want to add a time period to your query so that you can use it in a dashboard for example. There are some date functions to help. If you are unsure about how to add query parameters then you can go to the data that is returned and click the plus button next to the item you want to add to your query as below:

image

This will make the query look as follows:

exceptions

| where timestamp == todatetime('2019-06-26T18:21:49.1473946Z')

This is useful as you can add in >= to the query to find all logs that happened after this time but if you want to get all logs that happened over a specific period you can use the DateTime functions by typing a space after the greater than sign and see a list of the available functions

image

I use the “ago” function which also has help tips once you select it

image

As you can see there are examples for minutes, hours and days.

Queries are also built up using the pipe symbol so you can easily append.

If you want to summarise your data so you can get a count of each of the exceptions then you add a new pipe using the summarize keyword and the count function.You need to tell the query which property you wish to count. If you look at the “filter on” screen shot above you will see that there is a type property in the log record. If we summarize that property with count then the query will return all the exceptions in the timeframe and how often they have occurred

image

The query language also has a use “render” keyword that allows you to return the query in a variety of graphs

image

So the final query looks like this

exceptions

| where timestamp > ago(70d)

| summarize count() by type

| render piechart

image

Clicking the save button allows you to save your queries so that you can use them later or share them with other uses who share the same log analytics instance

image

In my next post I will show how you can use some of the other log tables, ordering and selecting the columns you wish to display

Adding Security Policies To Azure API Management

The Azure API Management service allows you to publish your APIs both internally and externally and to control who and what can access them. Out of the box you will get a standard API key for each of you users who sign up to the API, but this is often not enough meet the security requirements for you or your partners. API Management allows you to add a more fine grained security model you each of your APIs and this can be done using the policy feature. Policies are used for more than just security and there are numerous policies that allow you to change the behaviour of your API through configuration. Documentation for the types of policies can be found here. Sample policy examples can be found here.

Two policies that I am going to discuss here will allow you to restrict access to your API through IP Whitelisting and through validating JWT claims. I will also discuss how you can put different controls onto your API for different partners.

Policies can be set at different levels and the documentation will highlight the areas where they are applicable. For security policies I am going to talk about protecting at the API level and at the product level. Adding a policy at the API level will be applicable to all subscribers to the API whereas adding the policy at the product level will be applicable to all subscribers to the product. A product can contain multiple APIs and and API can be in multiple products. So we can add in protection at either level depending upon what your exact requirements are. The policies are the same but their impact will depend upon where they are applied.


Lets start with API level policies. To add or edit policies then you need to navigate to your API in the Azure Management portal. Then click on the API option, then click on the API you wish to protect

image

The easiest way to add a policy is to click the Add Policy link in the inbound section.

image

Click Filter IP Addresses and Add IP Filter

image

This form allows you to add ranges or single IP addresses to both allow or deny.When you have finished click Save.

You will now see the policy in the policy editor view. If you are happier to add this in manually or want to copy this and version control the config then you can access this via the Code Editor menu on the Inbound processing policies box

image

image

Appling this policy on the API means that only IP addresses within this range can access this specific API and can be useful to ensure that this specific API is blocked from being accessed regardless of the product has been subscribed to. Its also useful if you want to block access from specific IP addresses. However, you may have different partners who have different security arrangements or that you want to give different permissions to . To allow for this you will need to add the policy at the product level.

To edit the policy at the product level, click Products, pick the product you want to secure.

image

In this example I have a new More Secure API that I’ve created and there’s an access control section which allows you to pick the users who have access to this API

image

So I’ve immediately blocked access to this API to guest users and we can add user authentication to  the API if we want, such as OAuth 2.0 and OpenID connect.

However, this post is talking about adding security policies and if we want to allow only specific IP addresses to access this API we can edit the policy at the Product level. To access the policy definition click Policies

image

You’ll notice that this is just the editor view and the easiest way is to add the policy at the API level using the wizard and copy the config to here. Products are a mechanism to allow you to group and protect APIs which means that from a management point of view you could create a product for each of your partners making it easier to maintain the security details for each and make it easier to disable access and remove only the security policies that apply to the specific partner. Managing this at the API level means that you will end up with a large number of security policies relating to a large number of partners making it difficult to manage. Security polices at the Product level are more important when you want to do some specific protection like checking claims in a signed JWT. The Product level policy allows you to have different signing keys for each product meaning that you can have different signing keys for each of your partners (assuming one product per partner).

image

This policy requires a JWT signed with the key eW91ci0yNTYtYml0LXNlY3JldA== and that also has the claim admin=true. If there is an error then 401 is returned with the message “You have failed the security checks please contact your administrator”

To summarise, we can add policies at both API and product level. Product level polices allow us to create a new product for each of our partners and then add specific security policies to the product tailored to our specific partners needs. The product level policy makes it easier to manage the security policies at a partner level but we can allso add global security policies at the API level such as blocking access from certain IP address ranges. Policies can do a lot more than security so check out the links at the start of the post for further information

Using Azure Logic Apps to Import CSV to SQL Server

When Logic Apps first came out I wrote a blog post explaining how to convert a CSV file into XML.A lot of this is still relevant, especially the integration account and the schemas and maps that are in my github repo. This post will show how Logic Apps are now even simpler to use with flat file decoding and also show how to insert the CSV data into a SQL server. The SQL part of the blog was adapted from this post: https://pellitterisbiztalkblog.wordpress.com/2016/11/14/upload-flat-file-on-azure-sql-database-using-azure-logic-app/

Logic Apps has evolved since I last wrote about this topic and you now no longer need to create a function to transform our csv to xml.

clip_image001

The Transform XML connector is used now with the same maps we used in the previous post

In order to add the individual rows to the database there are a number of things you need to do. We will use an XML schema mapping in a stored procedure to extract the data from the transformed xml.

In your SQL database you will need to add a stored procedure, table and an XML schema, The SQL Scripts to create the table, stored procedure and xml schema have been added to the github repo. The stored procedure takes the xml file that has been transformed and uses the xml schema to extract the firstname, middlename and surname from the xml and then store the data in the employees table. In the logic app you need to add a SQL server connector and configure the connection to your Azure SQL database and also add in the stored procedure with the parameter as the output from the Transform XML.

image

The only other thing I needed to do to get this working was to remove the first row of the csv file as it contained the header fields and I didn’t want that inserted into the database.

image

The “length” expression is:  length(variables('csvdata'))

image

The “indexOf” expression is: indexOf(variables('csvdata'),'\r\n')

However if you add this in the editor the back slash will be delimited and you will end up with \\r\\n which will not work. To fix this you will need to click the View Code button, search for the \r\n and remove the extra back  slash

The “substring” expression is: substring(variables('csvdata'),add(variables('firstnewlineposition'),2),sub(variables('csvlength'),add(variables('firstnewlineposition'),2)))

The trigger for my Logic App was when a new file was added to OneDrive, so click the run button and then drop a file into the configured OneDrive location and the csv entries should be added to your database.

Cloud Load Testing Behind a Firewall with Visual Studio Team Services

Recently I’ve been looking at how we can load test one of our services so that we are able to understand the load our partners can put onto our systems before we start to have any issues. We used the Cloud-based Load Testing (CLT) service of Visual Studio Team Services (VSTS). I created a short video showing you how to easily setup a url based load test. The next stage of our load testing was to load test the service that our partners provide, Their service required IP whitelisting to connect which meant the CLT service would not be able to connect. Luckily for us the CLT service allows you to deploy agents into your own infrastructure  to carry out the load testing and they are controlled by the same CLT service that we used to load test our own service. This blog post will show you how to install the agent and configure the load test for this scenario.

The load test agent is installed using a PowerShell script which can be obtained from here. Open the PowerShell as administrator and don’t forget to unblock the script

clip_image001

To enable you to run the script and to configure the agents to talk to the CLT service, you will need to create a PAT token in VSTS.

Login and click on your user icon, then select Security

clip_image001[5]

Select Personal Access Tokens, then Add

clip_image001[7]

Fill in the form and click Create Token at the bottom of the page

clip_image001[9]

This creates your token and this is the only time you will be able to access the token

clip_image001[11]

You need to make sure that you copy it now as it you will not be able to access it after you have left the page,

Gong back to PowerShell, run the following command

.\ManageVSTSCloudLoadAgent.ps1 -TeamServicesAccountName StevesVSTS -PATToken 37abawavsmsgj6hpakltwhdjt4jrqsmup2jx62hlcxbju2l2tbja -ConfigureAgent -AgentGroupName StevesInternalTest

This will take a few minutes to run. If you didn’t run PowerShell as an Administrator you might see errors. When it has run the VSTSLoadAgentService should be installed and running

clip_image001[13]

Now need to configure a load test. Following on from my video, you can create a url test

clip_image001[17]

I ran a test web app in Visual Studio using localhost as the address

clip_image001[19]

When the test has been created select the Settings tab, click “Use self-provisioned agents” and select your agent from the list and add the number of agents you want to use. You could install the agents on a number of machines in your environment using the same script, then you will be able to add more than 1 agent if required. As I only installed the one agent I can only select 1. You can see how many agents the CTL service can see

image

If there are less than you think you will need to check to make sure the service was installed without error and that it is running 

Save the load test and run it.

clip_image001[23]

Whilst the test was running the performance meters in Visual Studio showed that the web page was being loaded.

When the test is complete you should see that it has not cost you any VUM (Virtual User Minutes) as the load tests are running on your own agents

clip_image001[21]

The Cloud Load Test service allows you to load test both publicly accessible and private websites and services. As long as the servers running the load test agents have outbound access to the internet for HTTPS then we are able to load test private sites and services and the load test does not cost anything apart from the cost of the infrastructure that the agents are running on locally.

Creating a Scheduled Web Job in Azure

It’s been a while since I’ve talked about web jobs, but they are still around.I needed to modify one of mine recently and configure it as a scheduled web job.

You can deploy your web job from the Azure Portal. Web jobs are part of App Services and are deployed by selecting your app service you want and clicking the web jobs service.

image

Click the Add button.

image

Enter a name for your web job, Browse a zip or exe containing your web job

Select Triggered from the Type drop down. This change the UI to allow you to select Scheduled

image

The Schedule is triggered using a CRON expression.

Alternatively, configure the web job as a manual trigger, then use the Azure Scheduler to trigger the web job.. When you have configured your web job, click on its properties in the Azure Portal and you should see a web hook url.

https://yourwebapp.scm.azurewebsites.net/api/triggeredwebjobs/yourwebjob/run

Now create a new scheduler Job

image

Select the method as Post and paste in the webhook url.Once you've completed this configuration you can then configure the schedule

image

Using the scheduler allows you to configure retry policies and also error actions